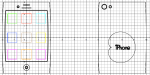
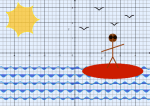
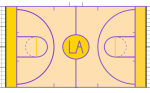
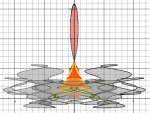
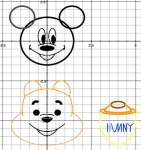
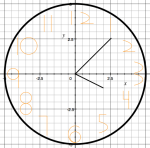
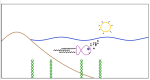
I’m teaching two sections of Multivariable Calculus this semester. Each class has 3 hours of lecture and a 1 hour 20 minute lab each week. Last week the students were learning about parametric equations. So in lab I wanted to give them some hands-on experience with 2-dimensional parametric curves. Their assignment was to create a work of art using Grapher (Apple’s free graphing program) and parametric curves. They worked on the projects in lab for about an hour (in pairs, mostly). Some finished in that time, but others finished outside of class. The results were fantastic, so I thought I’d share them here.
Here is a pdf of the lab assignment.
This lab was not my idea. It was written by my colleague Lorelei Koss. It was also classroom-tested by my colleague Jen Schaefer. This semester I took their feedback, changed the lab a little, and used it in my class. Lorelei said that she got the idea from Judy Holdener and Keith Howard at Kenyon College and Tommy Ratliff at Wheaton College. I’ve also found some similar ideas in the mathematical literature: there’s an article by Barry Tesman (also a colleague of mine) and Marc Sanders, “MATH and other four-letter words,” College Math Journal, Nov. 1998, and “Painting by Parametric Curves and Van Gogh’s Starry Night,” by Stephen Lovett, Matthew Arildsen, Jon Jones, Anna Larson and Rebecca Russ, Math Horizons, Nov. 2010.
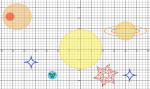
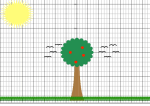
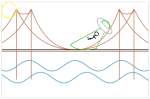
Here are their amazing works of art (click to see a slide show):
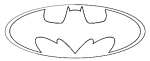


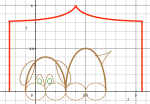


I’ve seen the “Batman Equation” (aka Batman Curver) multiple times before. Are you sure that wasn’t plagiarized, or at least insprired by the work of another?
http://mathworld.wolfram.com/BatmanCurve.html
Perhaps inspired by (although I didn’t see them on the web looking for it), but definitely not plagiarized. I saw them putting it together one curve at a time in lab.
I really like this idea. You could potentially use it for any type of graphs, couldn’t you? The idea being, using the software, students get some intuitive sense of how the graphs work. I suppose one could graph the equations by hand, but the difficulty with errors in graphing could negate the usefulness of the activity.
You could use it for other types of graphs, but the good thing about parametric curves is that you can easily get segments of curves.
Yes, true, but for a non-parametric function, this is the role of the domain and range of the function. Maybe working on an assignment like this would give students a more intuitive sense of domain and range?
That’s a good idea. I didn’t know if you could restrict the domain for ordinary functions, but after a little thinking I figured out how to do it. You create a piecewise function with only one condition. So, for example, to restrict to
to ![x\in[0,2]](https://s0.wp.com/latex.php?latex=x%5Cin%5B0%2C2%5D&bg=ffffff&fg=6a6c6e&s=0&c=20201002) you could enter
you could enter  .
.
Hah, “American” elephant looks great!
Hi, I like these. The “Froggy” looks great! I have ever found a funny frog-like monster but unfortunately with smaller eyes.
These are some amazing designs! The Batman graph has shown up many times recently, and I still question it’s authenticity, but these projects have come a long ways since the days we were learning to do math on computers in school!