We have all given exams where the grades end up lower than we hoped. A curve is in order. How do we do it?
In this post I share my thoughts on when you should (or should not) curve an exam. I give ten sample curving techniques, including pros and cons of each, I explain how to convert grades into letter grades, and I end with three concrete examples.
To keep things simple, I assume that the raw score of the exam is a percentage—a number between 0 and 100. From that we would like to obtain a curved or scaled grade which is again a score between 0 and 100 (or occasionally a number over 100). I am writing this as if the curve is for an exam, but most of the tips work for curving the grades at the end of the semester too.
To curve or not to curve
When I give an exam to a class, I have an intuitive feeling for how the grade distribution should look. I know, roughly, who the A students are, who the F student’s are, and who the average students are. This comes from their homework, their questions in class, our conversations outside of class, and so forth. Individual students may surprise me and do better or worse than I expected, but as a whole, I know the strength of the class when exam-time rolls around. If the class does significantly lower than I think they should have, I will consider curving the exam.
Also, courses have certain historical distributions. For example, in an entry-level course I may want an average (mean) of 80-82% with several A’s. In classes like that, failing grades are not unusual. For my upper-level (majors) class, on the other hand, I may expect higher grades with failures unlikely. If the scores do not fit the historical template, I will consider curving.
I may also consider a curve if there was one (usually high-point-value) problem on which everyone does poorly. I may want to make up for that with a curve.
On the other hand, if I feel that the exam was fair and the class should have done better, then I do not curve. Similarly, if I feel that the class is “weak”—that is, weaker than other classes who have taken the same course from me in the past—then I do not feel an obligation to bring their grade up to fit the template.
My advice is to use your judgement. You know the class, and you know the material.
What’s the goal of the curve?
Before you do any curving, you must determine what you want the curve to accomplish. Determining this will help you choose which curving technique to use. Here are some questions to ask yourself.
- Do you want a particular average?
- Do you want to give the lower-scoring students more of a curve or the same curve as the higher-scoring students? (Rarely do we want weaker students to get less of a curve than the stronger students.)
- Do you want everyone to get a passing grade on the exam?
- Is it OK to have a big group of A’s?
- Is it OK for some students to have a grade over 100%
- Do you want to protect the class from “curve breakers”—outliers who score much higher than the rest of the class and thereby prevent a large curve?
How do I curve an exam?
Below I present ten techniques for curving an exam score. In most case I describe the curve as a function, 

For example, suppose the curve is 
You can choose any function
1. 

2. 
Here are a couple of other considerations when defining
3. You probably want 
4. If you want the final score to be an integer you need to round (or if you’re feeling generous, round up) the grade after applying the function 
Here are ten curves you may want to consider.
1. Return, rewrite, regrade
What is it? This curve is quite different from the other nine, but is my favorite, so I am presenting it first. I can’t always use it, but I do whenever I can.
How it works:
- Return the graded exam to the students
- Have them rewrite the problems that they got wrong (completely re-write, not simply “fix”)
- Have them turn in the original and the rewritten one
- Grade the rewrite
- Give them a percentage (30%, say) of their new points
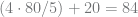
For example, if the raw score is 76% and the “grade” after the rewrite is 96%, the final grade would be 
I like this curve because it forces the students to go back and correct their mistakes, thereby learning the material that they did not know when they took the exam. They not only improve their grade, they learn from their mistakes.
There are times when this curve does not make sense. For example, if I wrote the correct answers on the students’ tests while grading them initially, then this would be a useless exercise. However, if I wrote comments such as “you need to justify this” or “use the chain rule here,” then rewriting could still be useful. I often write comments such as these in case I need to curve the exam.
One down-side is that this requires more time grading. However, since I have the original exam with my comments on them, it is much easier and faster to grade the second time through.
Pros: gets the students to learn from their mistakes, lower-scoring students can get larger curves
Cons: more grading for you, a little complicated to explain to the class
Use when: whenever you can!
2. Flat scale
What is it? This is the simplest and probably the most common means of curving an exam. Simply add the same amount to every student’s score. The function is

where 
I like to use the flat scale when my exam has one unfairly difficult problem that no one can solve.
Often professors do not want anyone to score over 100% on an exam. In this case a “curve breaker” can limit the professor’s ability to apply a curve. If the highest grade is a 97%, then a 3-point curve is all that is allowed, even if the mean is 60%.
Pros: easy to explain to students, easy to implement
Cons: doesn’t significantly help the students who did poorly, can have grades over 100%
Use when: to make small global adjustments, to make up for a single very hard problem
3. High grade to 100%
What is it? In this curve, the professor scales the grades so that the student with the highest grade in the class (call it 

The major problem with this method is that it gives the stronger students a better curve than the weaker students. For example, suppose 
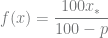
A modification of this method is to compute the percentage of some other score 


Pros: I can’t think of one
Cons: high-scoring students get a larger curve
Use when: maybe useful if there is one question that everyone, or nearly everyone, missed (see “remove question curve” below for another option).
4. Linear scale
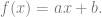
What is it? Both of the two previous techniques are specific cases of a linear scale of the form
I use linear scales for my curves all the time, but I view them in a slightly different way. I pick two raw scores (


For example, I often want the grades to have a specific average, say 80%. So, if the mean of the raw scores is 76%, then (76,80) is one point. Then I may take the low score (or high score) and force it to go somewhere. Say the low score is 58% and I want it to be 64%. Then the second point is (58,64). So the function becomes

I always check rules (1) and (2) for defining
The one possible down-side of using this method is that different students gets different curves. I’ve never received a complaint about this, but I can imagine it.
Pros: very versatile, can be used to give an extra boost to the weakest students, can adjust the mean to be a target value.
Cons: a little complicated to set up, different students get different curves
Use when: you are willing to finesse the scores to fit the distribution you want
5. Remove a question from the grading
What is it? All of the students, even the A-students, bombed one question. Afterward I realize that it was not appropriate for the exam. I want to excise it from the exam completely. The function becomes
where 

(Of course I would not want to use this curve if the question was fair. There is nothing wrong with putting challenging questions on an exam.)
Pros: students relieved that this question is gone!
Cons: makes the other problems worth more, there may be a handful of students who did well on this problem—they’ll feel cheated
Use when: there is one bad question on the exam
6. Root functions
What is it? I have heard some people suggest the following curve: “take the square root of the score.” By this they mean treat the raw score as a value between 0 and 1, then take the square root. For scores between 0 and 100 this becomes

I propose the following generalization of this curve:

for some chosen value of 

This curve has the property that students whose raw score is 0 or 100 get no curve, and the lower scores (except for very low scores) get a larger boost than higher scores. To be precise, the largest curve will be for the student who got a grade of 

Here are a couple of examples.
First, the square root example: 
- raw score=25%, curved score=50% (this is the maximum possible curve)
- raw score=50%, curved score=63%
- raw score=75%, curved score=87%
- raw score=90%, curved score=95%
Next, consider 
![f(x)=\sqrt[3]{100 x^2}](https://s0.wp.com/latex.php?latex=f%28x%29%3D%5Csqrt%5B3%5D%7B100+x%5E2%7D&bg=ffffff&fg=6a6c6e&s=0&c=20201002)
- raw score=30%, curved score=45% (this is the maximum possible curve)
- raw score=50%, curved score=58%
- raw score=75%, curved score=82%
- raw score=90%, curved score=93%
This seems like a fine curve. I’ve never used it. It seems unnecessarily complicated and the linear curve is flexible enough that this curve is unnecessary.
Pros: can be used to give an extra boost to the weakest students and a smaller boost to the strongest students
Cons: complicated, hard to explain to students
Use when: you really want to test your skill with the spreadsheet
7. Bell curve
What is it? Here’s the way I understand the “bell curve”: make the mean a C, then the mean plus/minus a half standard deviation would be the C-/C/C+ scores, one more standard deviation out would give the B’s and D’s, and the tails would give the A’s and F’s. This could be tweaked in any number of ways—change the mean, fatten or slim the distribution.
I don’t know if this is used by any professors anymore (in small classes, at least).
Pros: grades end up with a very predictable distribution
Cons: ruthless, students competing against classmates
Use when: for standardized tests in which only a certain number of students can pass, for large classes or multiple sections when there must be a fixed distribution
8. Extra credit problems
What is it? Give the class some challenging question to solve. If they get it right, they get extra points on their exam.
Don’t do it! Extra credit problems typically benefit the stronger students (who do not need the points). The weaker students do not try or cannot solve the extra credit problems. If a weak student in my class is going to spend extra time working on my class, then I would like it to be on the core material, not on extra credit problems.
9. Grading by gravity
What is it? Toss the exams down the stairs—the farther they fly, the higher the grade (or lower, if you want).
10. “I don’t believe in grades”/”I’m a grouch waiting for retirement” grading
What is it? Give everyone an A or everyone an F.
How to assign letter grades
I don’t like letter grades. I only use them at the end of the semester when I have to submit my final grades. What good are they in the middle of the semester? How do you average a B-, an A, and a B+?
This is the procedure I use at the end of the semester.
1. Decide on a fixed scale—i.e., how to translate percentage grades to letter grades. There does not appear to be a standard for how to do this. Here are two examples—one for straight letter grades and one including +/- grades (my college does not have an A+, but I included it because some schools do).
| Percent (min) | Grade | Percent (min) | Grade | |
| 0 | F | 0 | F | |
| 60 | D | 60 | D- | |
| 70 | C | 63.3 | D | |
| 80 | B | 66.7 | D+ | |
| 90 | A | 70 | C- | |
| 73.3 | C | |||
| 76.7 | C+ | |||
| 80 | B- | |||
| 83.3 | B | |||
| 86.7 | B+ | |||
| 90 | A- | |||
| 93.3 | A | |||
| 96.7 | A+ |
2. Quickly go through and assign letter grades using this scale.
If you are using Excel you can use this function to assign the grades automatically (if the percent grade is in column A):
=LOOKUP(A1,{0,"F";60,"D";70,"C";80,"B";90,"A"})
=LOOKUP(A1,{0,"F";60,"D-";63.3,"D";66.7,"D+";70,"C-";73.3,"C";76.7,"C+";80,"B-";83.3,"B";86.7,"B+";
90,"A-";93.3,"A";96.7,"A+"})
If you are using Google Docs you can use this combination of functions:
=INDEX(FILTER({"A";"B";"C";"D";"F"};A1>= {90;80;70;60;0});1;1)
=INDEX(FILTER({"A+";"A";"A-";"B+";"B";"B-";"C+";"C";"C-";"D+";"D";"D-";"F"};A1>=
{96.7;93.3;90;86.7;83.3;80;76.7;73.3;70;66.7;63.3;60;0});1;1)
3. I always go in and see if any of the grades need tweaking. I try to put the dividing lines between the grades in the “gaps.” For example, if there are students with grades …87.8, 88, 89.8, 90.0,…, then I will likely bump the 89.7 student up to an A-. I also bump the borderline students up or down depending on class participation, attendance, tardiness, illnesses during the semester, etc. (Except in exceptional circumstances, I still avoid letting students “leapfrog” each other.)
4. I take a close look at the failing students. I don’t like failing them, but it is often the right thing to do. Despite the atmosphere of grade inflation, do not pass a student who should not pass.
Examples
Finally, I am going to end with three examples. I created a spreadsheet using Google Docs and included sample scores of 45 students. The mean of the raw scores was 75.1%. I applied three different different curves all of which raised the mean to approximately 82.1%.
Flat curve:

Linear curve: 
Root curve: ![f(x)=\sqrt[3]{100x^2}](https://s0.wp.com/latex.php?latex=f%28x%29%3D%5Csqrt%5B3%5D%7B100x%5E2%7D&bg=ffffff&fg=6a6c6e&s=0&c=20201002)
The histograms are shown below. As you can see, the distributions are quite different.
(See the Google docs spreadsheet.)
I would be happy to hear your thoughts, comments, and ideas!

I no longer curve individual graded parts of my courses. Partly because if one exam / homework was harder, I compensate by trying to make the next one a bit easier. But also vice versa: I will make a harder exam if everyone did well on an earlier one. At the end, I am open to curving the whole course. I haven’t had to in recent years.
I announce grade cutoffs on the syllabus, and waffle on them only by rounding up rather than rounding off without telling students that I do that.
Since a student’s grade in a course is often (always?) the result of a combination of ability and effort, I have taken to providing opportunities for extra credit that do not require ability (like writing a paragraph about a talk attended). This gives me a sense as to how much effort a student is giving the course.
On those inevitabe surprise difficult problems on an exam, I usually discover that fact while grading, and weigh such problems less. This does not penalize the best students, who get the difficult problem correct, unless one argues that if they lost credit on an easy part because of carelessness, now their bad care weighs more against their good skill. But it does so uniformly for all students.
My college has something that yours doesn’t have: A narrative to explain the letter grades. At the end of the semester I have never seen the the student’s objective numeric grade put a student in a different narrative category than my shoot-from the hip estimation based on getting to know the student. Since this narrative was created, +/- was added to grades (with no A+, no D-), and there is some wiggle room there, I agree.
If a student at a borderline causes me more than about 30 seconds of grief in trying to decide whether to go up or down, I go up. That’s rather like the tilting paper on the edge of a stair in the stairstep method that you link to!
I have a grading program that automatically emails students their grade-so-far whenever I want, usually every 2 weeks. This gives them feedback as to how they are doing, and gives me feedback in case I have entered a grade incorrectly.
I used to worry too much about student grades, sometimes even more than the students did. I try now to let the students do the worrying.
Thanks, Gene! All very interesting. I find that I don’t curve the final grades up too much. So for me it makes sense to curve during the semester.
I don’t usually have the problem of giving exams that are too easy, although it does happen sometimes. Giving an easy exam on purpose may not serve the students well when it comes time for them to study for the final exam—they may have a false sense of security and not study that material sufficiently.
Assigning grades has always given me a lot of anxiety. I am going to consider using your 30-second rule.
The lookup is simpler and more efficient if you set up a point-grade table first (=vlookup(cell,grade_table,2,true). If you want to change the cutoff points, you can without having to change the internal arguments of every lookup function.
I grade on a strict points-based system with no rounding. No whining about curves, it’s fair, and it’s easy.
Yes, the table method works well. I’ve used it before. My single-cell approach can be changed easily too. Just change the top cell and “fill down” to update the rest of the column.
Thanks for the curving tips! One of my low performing classes bombed their recent midterm and I decided to use technique 5 to straighten out their grades. It helped me throw out a few upper level questions that the kids could not understand. I was hoping that I wouldn’t have to curve the exam, but I’m dealing with 9th grade students who have yet to discover the fine art of study skills.
Thanks for the list! I usually don’t curve grades but just gave an exam with only one A and ten F’s and lots of C’s and D’s. I’ve decided to give them the same exam again (before they get to see their original scores) and let them do this in teams. I’m hoping the process of explaining to each other why an answer is correct or not will help the material “stick.”
This was so helpful! I am a physician teaching as an adjunct professor at a university- I am teaching mostly non-premed undergraduate students about diseases. I received very little direction in actually teaching and I am either trying to cover too much or am expecting a higher level of work than I should. These comments about grading on a curve are extremely useful for me. (Any other pointers would be appreciated too- for example what do I do with a student who has missed multiple classes and several tests yet asks how to make up the work?)
To Dr. K:
I am Dr. N; and I am in the same exact (no kidding) position as you. And this site has been extremely helpful in guiding me on how to deal with tough situations. In fact, I am posting final grades tonight. I have already told my students that not all will be happy. But I also emphasized that I do not ‘give’ grades; they are earned!
Thanks to Dave.
Dr. K.,
My general response is that such students is out of luck (i.e., they get a zero on the exams and can’t make them up). However, each situation is unique, so you should start by chatting with the student. If the student has is a legitimate excuse (even that is hard to define or verify), then you may want to work out a scheme for them to make up missed work. Most schools have an “incomplete” grade to allow students to finish work after the end of the semester.
Good luck!
Great ideas for curves, but I would try to avoid any curving until the end of the semester; too much curving, to me, distorts the quality of the grades the students have gotten by the time you’re ready to compile the final grade. I think it’s a good idea to give a conversion range after each exam and say something like:
“An 85 and above would be like an A or an A-”
“An 80-85 like a B+”
“A 75-80 like a C+”
and so on…
and only let the people who you think would fail know that they are in danger of failure. Because unfortunately, we live in a very competitive country where too much of the emphasis it put on things like this–grades, that is.
Of course, that’s not to discredit the techniques of curving–some of them are brilliant! :)
Unfortunately school, at least college is a business. Grade inflation is prevalent and standards are lame.
If students get the grade reflecting their ability, the test is fair, and the teacher competent there is no need to curve anything.
But the reality is, students are students, they dont study and have the attention and concentration of a tv commercial or mp3 mind numbing song.
With grade inflation, social promotion and economics.. students are leaving college with 6th grade math skills, if that.
Many students comment they are buying a piece of paper. It seems so. The military students are the worst… their school is paid for.. and you mean I have to read the text book, attend class and do homework? Oh I forgot to register for the final or find the campus… but its ok, I can shoot and kill people.
Oooh ra!
I actually find military students to be the most disciplined, hard working students I have. They do not have the sense of entitlement that is typical of this generation and they provide great balance in the classroom.
I have yet to have a current or former serviceman as you describe. They are the most conscientious students. You sound a bit disgruntled!
Creo que éstas formas de asignar calificaciones son necesarias. En ocasiones, los maestros elaboramos exámenes con errores en la redacción o con dificultad excesiva, además de la presión propia del examen.
Es justo compensar de alguna manera nuestras fallas.
Buen trabajo!!
I love the redo-rewrite-regrade thing, but your formula is missing some brackets that are crucial to proper computation.
What you want is
original score + [(new score-original score) * .3)]
Hi Sheri, %?
%?
Thanks for the comment. I don’t see what line you are concerned about. Is it this one:
I think that that is unambiguous using the accepted order of operations. If there’s something else, please post another comment.
Thanks!
Maybe I’m thinking in terms of the “old” math (I haven’t taken a math class since my senior year in high school in 1982).
In any case — I believe I want to subtract the old grade from the new grade, take the result of that times .3, and then add THAT result to the old grade.
Non?
Sheri, . The order of arithmetic operations says to multiply before adding. So in both situations I am multiplying by .3 before I add the 76. I hope that helps.
You are right that that is what I want to do, but that is what I wrote. These two expressions are equal:
Your variables on #4 Linear are incorrect. You have misplaced y0 and y1.
Megan Sorry, I don’t see the mistake. The way I have it set up and
and  , just as we’d want. If I’m missing something, let me know.
Dear Dave,
What is your opinion on the following?
Find the standard deviation (SD). Subtract one SD from 100 and have that be the A-range. Subtract one SD from the bottom of the A-range and have that be the B-range. And so on and so forth.
i.e. Suppose SD = 15. Then
85<A<100
70<B<85
.
.
.
To determine B+, B, and B-, divide the SD by three and apply to the grade-specific range.
i.e. Again with SD = 15
80<B+<85
75<B<80
70<B-<75
I'm thinking that with too large a standard deviation, perhaps this curve would not be the best idea, I don't know. Could you remedy that by dropping outliers?
Thank you for your time.
Sincerely,
Phillip
This is a great website. I teach both high school and college and have used a number of these methods, particularly the root functions. I do my best to fight the rampant grade inflation that is out there, but sometimes my test averages are below a C, and curving is necessary.
Does anyone else remember the bad old days when a C actually meant “average”, B meant “good”, and A meant “excellent”?
Dave, I don’t grade papers for a living but I do help my husband keep up with grading his students’ tests. (He’s in his second year of teaching.) He had the occasion to curve a test recently and we used one of the methods listed. I won’t say which, though!
I can’t tell you how useful this information will be to him should he need to employ any other methods. Thank you for your detailed explanations.
Lori
I’m glad it helped. This was a fun post to write. I’m have two stacks of exams to grade right now with a third coming tomorrow. I’m hoping I don’t have to employ any curving on mine, but we’ll see!
Hi Dave, I’m with Megan above– isn’t there a problem with the formula you provide for the linear curve? (I’m trying to figure out how to apply it myself.)
You originally give the formula as:
f(x) = y0 + [(y1-y0)/(x1-x0)]*(x-x0)
However when you apply it in both examples, you seem to be using the formula:
f(x) = y1 + [(y1-y0)/(x1-x0)]*(x-x1)
can you check your formula vs. application again?
thanks!
Emily
Emily (and Megan),
Thank you for making more clear the problem that you have! You are right that I used different variables in the abstract form that I gave above and the example that I gave below. However, BOTH are correct. I’m using the point-slope version of a line. It requires a slope (which I gave in both cases as (y1-y0)/(x1-x0)) and a point on the line. In the first case I used the point (x0,y0) and in the second case I used (x1,y1). They should both give exactly the same function (try both and simplify to see that!). But now I see why it is confusing.
I think I’ll change the example—to prevent others from being confused about this change in notation.
Thanks!
Yes, I see what you mean… thanks for the explanation, and for your very detailed post on the subject– it’s brilliant, and has solved my grading dilemma.
Thank you! This whole page was extremely helpful with the debacle that was the first exam this term. As a history professor, my first thought was that the gravity method might work for me, but being a secret math geek I really enjoyed working out the linear curve for this exam. I’ve only used a version of the “flat scale” method before.
Thanks again!
Math Prof here: Nice website, I am looking for guidelines for inexperienced adjuncts and may use some of your suggestions.
Personally, I DO use the bell curve if I have to curve, e.g. when the average is below a 75%. Generally some curve is necessary in calculus I, II. However, I use the curve as a starting point, then do some tweaking. I also am more generous, making the median (not the average!) the lowest B-. That way (before tweaking) half of all students get a B- or above, and half a C+ or below.
Thanks for this. I have been using the flat scale, and just accepting there will sometimes be a score or two over 100. I do like the linear scale idea. However, I don’t fully understand the justification of boosting the lower scores more. It seems like it is rewarding students who may not have prepared enough.
One thought — could this linear scale formula use medians instead of means? Medians tend to be more stable.
that is not always true. the professor can word the questions ambiguously and make it difficult for students. If there are mostly failing grades then obviously something is wrong with the exam
“If there are mostly failing grades then obviously something is wrong with the exam”
This is not at all the case. Sometimes a subject is inherently difficult, and yes, failures should be anticipated. Your attitude is what has caused rampant grade inflation – and the eventual decline of America – in the first place.
the idea that grades are pre-supposed is disturbing.
that is such a limited observation in itself.
-hardly scientific-
still there seems to be a range of options in helping the persons- in reading everything here- who may be experiencing difficulty -which is outside the mathematics.
i have been perplexed enough to wonder why it was ever applied to a visual arts course- it’s supposed to be about individuality.
Hi
Im a third year undergraduate from auckland new zealand. I, trying to appeal to the administration of our university. Im enrolled in an incredibly competitive speech and language pathology undergraduate degree. 20 students are accepted per year. the university also grades on a bell curve- no more than 25% of grades are to be a’s, and no more than 70% a’s and b;s.
This leads to a competing and sabotaging environment within the degree. some students will purposely try to mislead others!.
Im currently on a b+ this puts me at number four but all my marks are over 85%- which is wroth an A. I want to do my masters but am aware that I dont have an A average (4.0 in american terms). It frustrates me to no end, as I want to be allowed to enjoy my learnign.
I was thinking or prepositioning my lecturer to at least include a letter or percentaeg grades earned? or considerign switching to another uni for my final year
any thoughts on the fairness of this?
thanks
Thanks so much for this excellent posting, Dave! For my first university lecture class, I was planning to employ a bell curve solution, but your website helped me see there were better ways to go about curving.
One question for you, on the last exam (which was multiple choice), I gave the students 1 extra credit problem. How do you think I should proceed? Should I curve grades before taking into account the extra credit or with scores on that question already accounted for? or is there a better way to do it?
I came upon this site while researching grading curves for a friend in law school. My education was years ago when 93 was an A, 86 a B and so on. Grading on the curve was done only when everyone passed. It was then necessary to curve to assign a percentage A and an equal percentage as F with the various grades falling in between.
Most of the curving examples shown are designed to reward the lowest performing segment of the class. With the failing grade lowered to 60 I see no reason to curve grades up. A student who cannot test at 60 deserves to fail. Unless the test covers material not addressed in class there is no such thing as an exam which is too difficult.
Is the purpose of curving up to enable low performing students or to make the professor look more effective in teaching?
Thanks for the website. I really like the linear curve and want to use it for my class. I do, however, feel a bit like Robert right above me. I have a bit of a problem of rewarding a student who failed and just didn’t study.
How do you or everyone else deal with this? I know the kids who flirt with 60 percent or below and ARE trying. And I know the ones who aren’t. HOw do you help the ones who need it without bailing out the lazy ones?
Max and Robert,
If you read my section on “to curve or not to curve” I discuss my feelings on when it is appropriate to curve the grades in a class. I never curve to reward or “save” a student who is in danger of failing the class. Most times I curve because I’ve written a bad exam or a bad question (or at least one that was too difficult for the level of the class). Experienced teachers often have a feeling for when that happens, especially after seeing the responses of the students in the class.
The students who try hard, but can’t pass the class probably need to fail and retake it. It is inappropriate for me to artificially inflate their grades. Besides, it isn’t doing them any favors, especially if they plan to go on to the next course. Instead I try to work with them outside class, help them find a tutor, suggest study-techniques, etc. My goal is to get them to learn the material.
Foreign Lanuage Teacher here. Thanks! #9 and #10, after I had seriously pored over the previous examples, almost had me wet my pants! Thanks for the laugh and the bright info. Math is not my strong suit as a linguist and let me assure you that I appreciated your clear and concise pros and cons!
Thanks so much for this information. I teach an introductory biology course which has both majors and nonmajors in it. I routinely see a bimodal distribution, with students who have had some biology in high school doing well to very well and beginner students struggling. I want to make the exams challenging enough to be worthwhile for the experienced students, but that sometimes leaves the beginner students in the dust. The linear curve allows me to make a more challenging test without having half the class fail.
Love your blog! I convert raw scores using the Excel
function ‘STANDARDIZE’, then adjust them further using
f(x)=STD(x)(a)+b, where a = standard deviation between 5 and 10, b
= mean between 70 and 80, and min >= 60 and max <=
100 and final distribution is symetrical. ID raw STD(x) adj raw adj
015855 35 -0.50 75 A 0 3 368689 40 0.05 80 B 0 8 317023 28 -1.26 67
C 0 8 141947 45 0.59 86 D 0 2 248364 30 -1.04 70 F 21 0 303801 48
0.92 89 21 21 460857 47 0.81 88 471315 40 0.05 80 358163 30 -1.04
70 399514 32 -0.82 72 92040 47 0.81 88 340537 33 -0.71 73 450884 32
-0.82 72 443005 58 2.00 100 181131 32 -0.82 72 448148 55 1.68 97
423063 42 0.26 83 325937 37 -0.28 77 327396 27 -1.37 66 336205 53
1.46 95 479710 40 0.05 80 Median 40 0.05 80 AVG 40 0.00 80 STDEV 9
1.00 10 min 27 -1.37 66 max 58 2.00 100
another linear function
f(x) = target mean + target sd / raw sd (x – raw mean)
for the linear curve, why not use the median instead of the mean
Excellent presentation, Mr. Richeson!!! I would like to ask your permission to refer/use your site and information contained within for our faculty forum discussion regarding exam score adjustment. I would like for us to come to a more “standard” process so that we can better serve ou students.
Thanks so much!
Thank you! I’m a language teacher, so I usually do letters not numbers and it’s been a while since multivariable calc… This really helps!
I did not see mentioned the curve I use, which is about 1/2 between the flat and the percent.
f(x) = x + (100-MAX)
No body scores over a hundred, it’s easy to explain and calculate, and really is there to correct for my making bad questions that the top students cannot answer. Usually this comes out to +2 points or so per exam, but I’ve had it as high as 15 points.
That’s interesting, but a problem I see is that it is very sensitive to outliers. For example, if all the grades were in the 60’s, but one person got a 98, then there would only be a 2 point curve.
As an undergrad in a large Biology class (~600 sts as I recall), we had three major exams, two lab practicals and four quizzes (interesting sidebar: this was in the early 80s. The quizzes were computer-based and consisted of 10 randomly selected questions from a bank. Each student was expected to achieve 80% or better on the quizzes and we all could take the quiz up to three times to achieve that goal).
Anyway, at the end of the term, I had done pretty well but suspected I was borderline A/B. I visited the professor’s office and saw “grading on a curve” being done in real time. The TAs had generated a frequency histogram for the entire class and had printed it on one long computer printout, many feet long. The professor was on a ladder attaching it to the top of a wall so the entire chart could be seen. Climbing down, he stepped back, had some conversations with some of the TAs and directed one of them (on the ladder) to draw dividing lines at four specific places. The five groups separated by the lines became A, B, C, D and F. He was kind enough to explain his rationale to me – he knew that grading was imperfect and the means he used to evaluate student performance (tests and quizzes) was at least partially subjective. He wanted to avoid having students miss a grade cutoff by a small number of points so he looked for large gaps on the frequency histogram. He used these gaps as cutoffs and had found them to be beneficial when students came to inquire about how their grade had been determined.
I hadn’t decided to become a teacher yet – that would come a couple of years later – but this highly illustrative example never escaped me as I, in turn, came to grips with my own grading dilemmas. Histograms of small group performance didn’t always generate the desired natural breaks for A/B, B/C, etc. but it did the trick much of the time.
Wow! What a useful blog post for all of graders out here!